Performance testing is an umbrella term to describe different types of software testing that check how responsive a system is under various circumstances. While there are many different types of performance tests, they all share the same goal of isolating performance bottlenecks so they can be fixed. Load test tools are available to help execute these tests, but software engineering teams still need to develop their own processes to monitor the test results. To help, I've compiled this guide that covers what you need to know about performance testing metrics, reporting, and analytics.
Performance testing metrics
To begin, let us identify some key metrics that are useful indicators when identifying performance bottlenecks. To explain these metrics, it's useful to start with the questions we aim to answer with performance tests and then work from there.
How much request traffic is being sent?
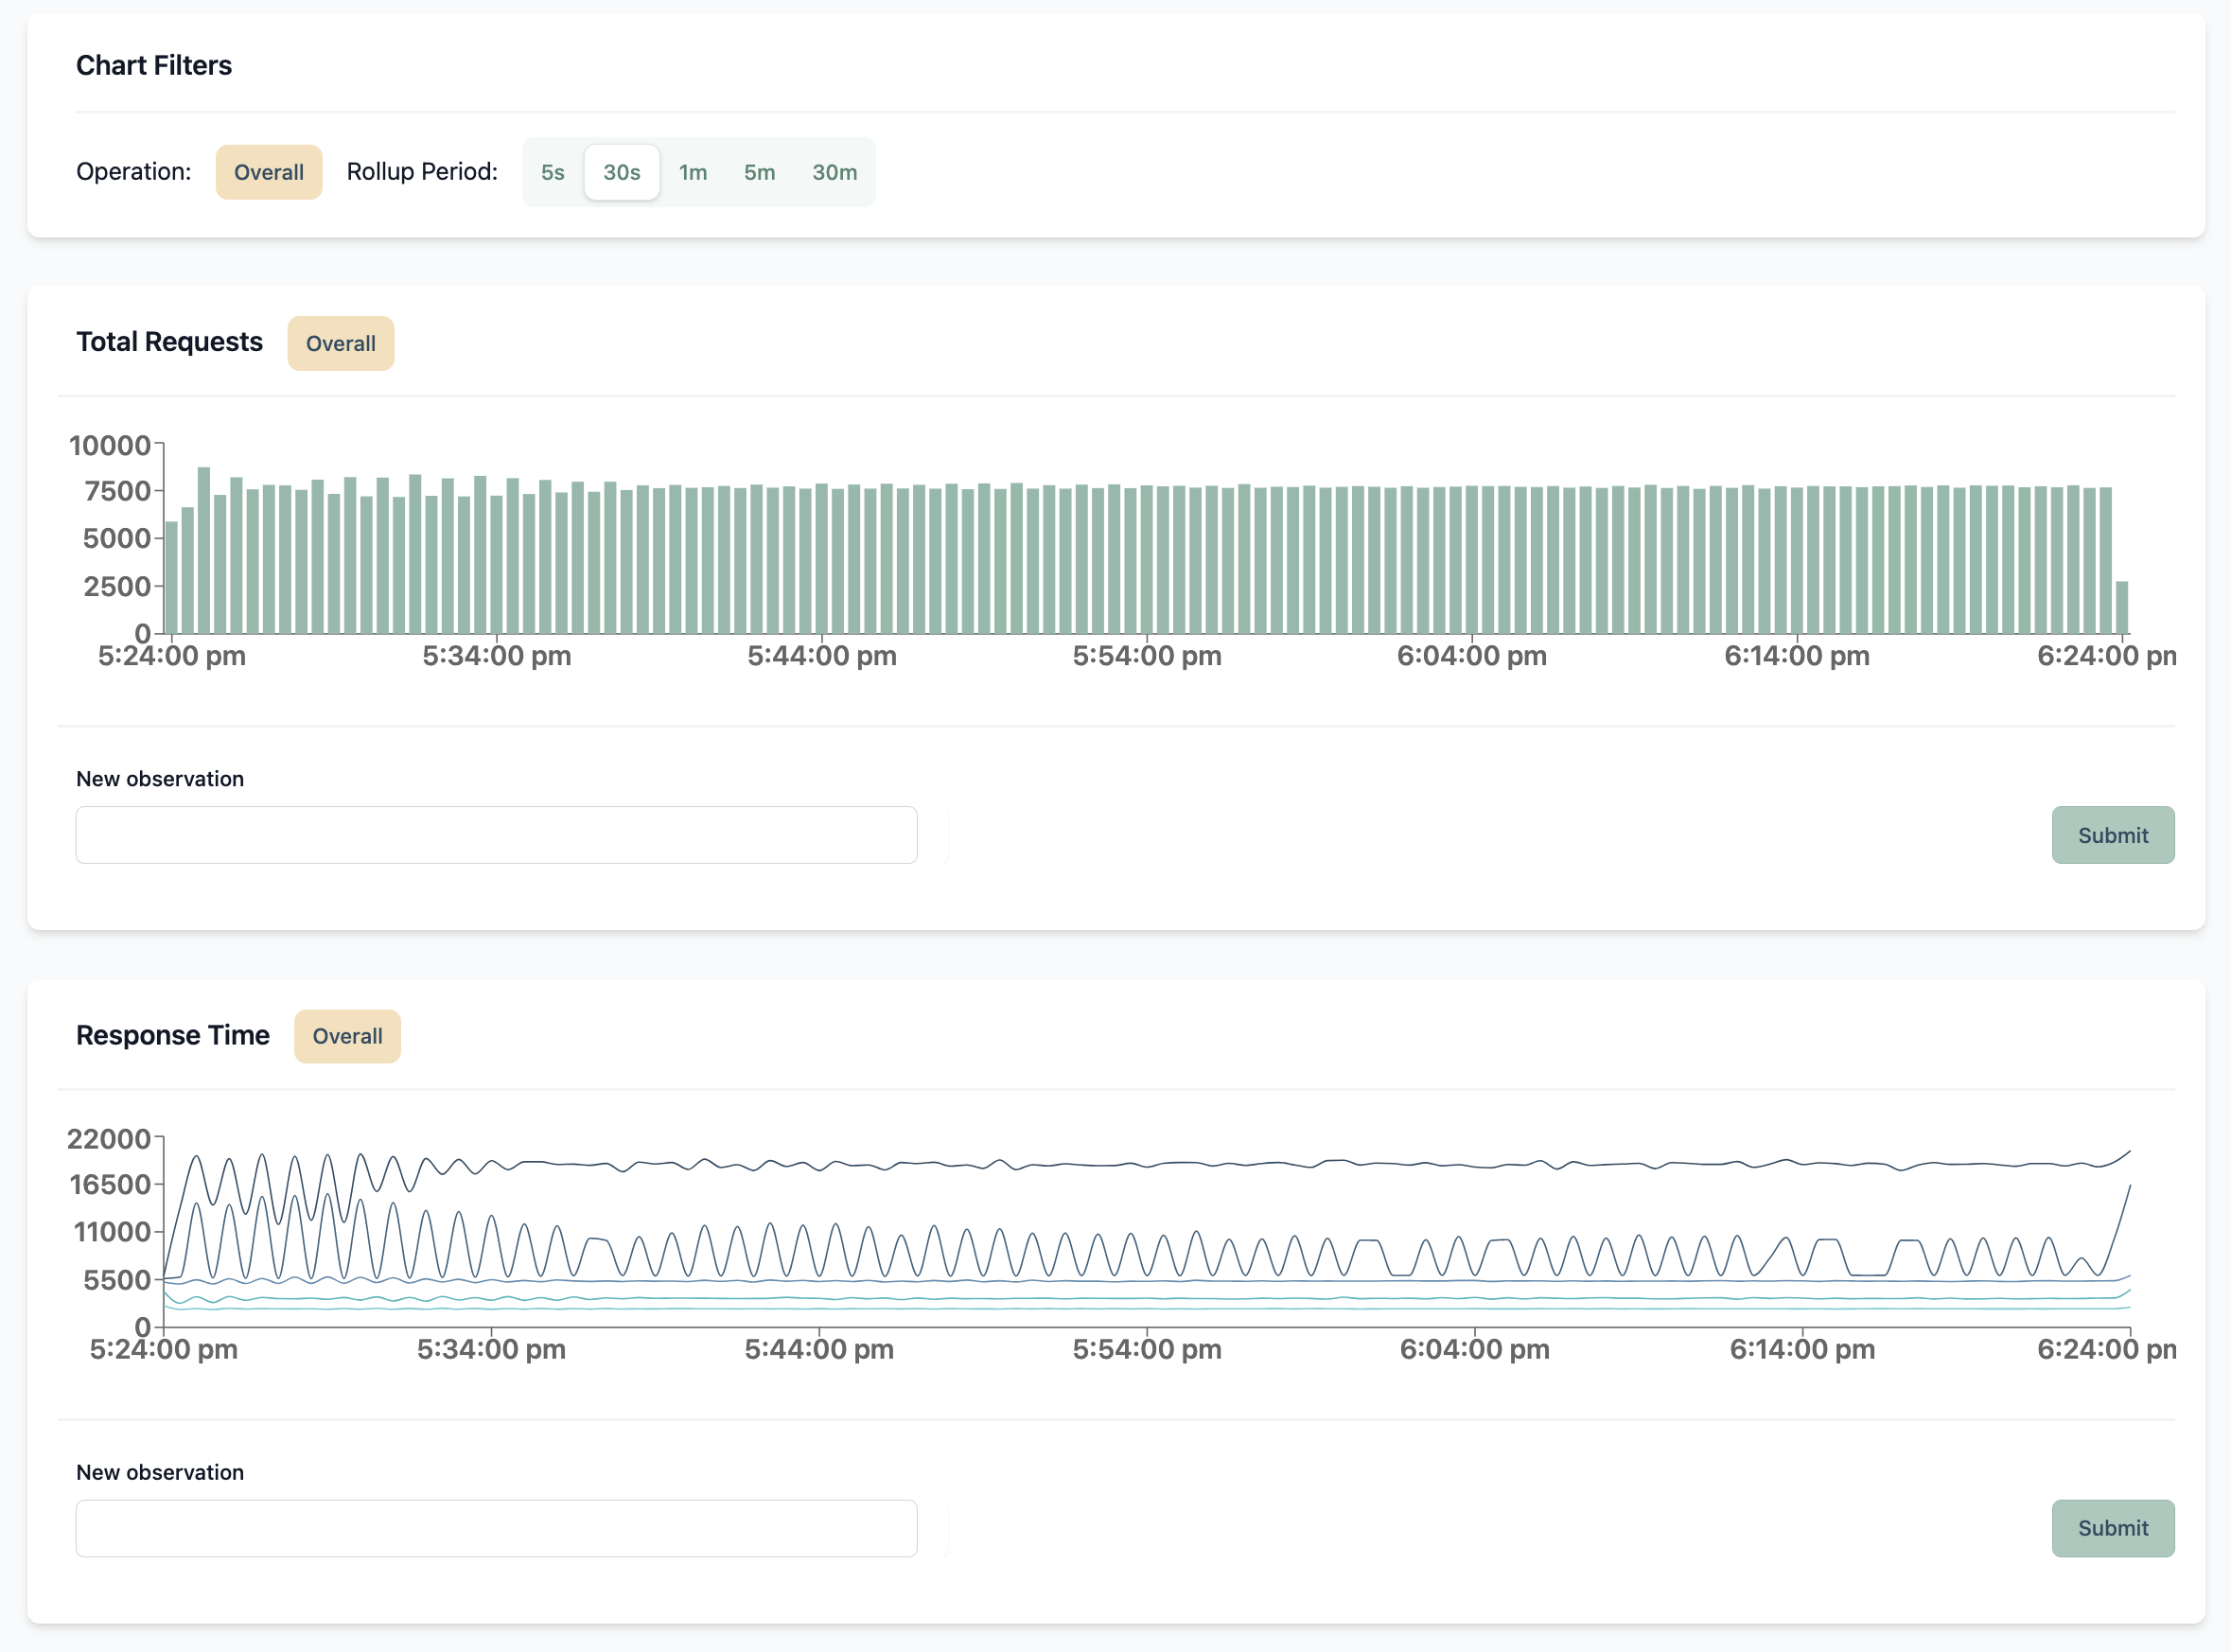
Metric: Request count. This tells us how many requests are being sent to the service from our load test runner tool.
How many errors are there?
Metric: Failure count and rate. This signal shows how many requests were unsuccessful, typically depicted by an error response status code. It is useful to break this down for known error types or status codes.
How long did it take for the service to respond?
Metric: Response times. This can include network overhead along with the time the service took to process our request and provide a response. For these metrics it is extremely useful to have access to various percentiles of the values. A common set of percentiles to monitor for response times are p50, p75, p90, p95, and p99. By capturing these different values you can better understand how performant your user experience is across the board. This article by Dynatrace helps explain why.
How many concurrent users are involved in the test?
Metric: Virtual user count. This is another indicator to show how much traffic we are simulating in our load test. This may seem similar to reqest count, but the difference is that virtual users are the threads or processes responsible for sending the requests. There should be correlation between these metrics, so it is useful to compare this metric with request count to see how the service is handling the increase in user volume.
Do the servers have appropriate resources to handle the load?
Metric: CPU and memory usage. This can be in reference to the client executing the load test or the servers accepting the test traffic. An overutilized client can act as a bottleneck and cause unintended test results. If your client is hitting a bottleneck despite healthy CPU and memory usage, you may need to update your OS settings for resource limits, eg. ulimit.
Performance testing dimensions
Metrics are quantitative values that alone would represent an overall view of your systems. It is often not useful to analyze metrics across all your systems and environments. To better query and gain insights from these metrics, you can associate these metrics with descriptive attributes known as dimensions. By tagging each metric with these descriptive attributes it makes it a lot easier to navigate and make sense of this data.
Here are some common dimensions used to tag performance testing metrics:
- Hostname: The host where the metric is emitted.
- Environment: The environment where the metric is emitted.
- Test plan: The name of the test plan that is being executed.
- Operation name: The name of the HTTP operation (eg. HTTP method and URL) being executed.
- Status code: The HTTP response status code.
- Error type: Category of error received by the service.
Where to collect metrics
These metrics should be collected on both the client and server sides. The client is the environment where the performance test is being executed. The server is the application being tested.
Some teams opt for just collecting metrics from the server side as part of their application performance monitoring, but this can cause discrepancies due to network latency, network failures, server request queueing, cached requests, overloaded test environments, and server middleware overhead.
To allow for correlation between metrics across the client and server sides, you can leverage HTTP headers and trace IDs. The strategy of how this works depends on how you store metrics, which is discussed in the next section.
Where to store metrics
There are a few options when deciding where to store these metrics. If you prefer to self-host, you can use a combination of InfluxDB and Grafana. For managed solutions, I recommend Datadog, NewRelic, and Dynatrace.
For your server-side integration, each of these observability platforms offers SDKs that you can use to publish metrics. Client-side metrics may be a bit more difficult depending on which tool you use to execute load tests. If you're using JMeter, you can install a custom backend listener that publishes metrics to these platforms.
Test metric reporting
Each of the observability platforms from the previous section offers flexible reporting and visualization tools to build test results dashboards. That being said, these dashboards can be difficult to define and maintain without the appropriate domain expertise.
You can build a dashboard that highlights your business KPIs using the metrics and dimensions mentioned previously. A common approach is to build a shared dashboard that allows dimensions to be specified through variables. This allows your dashboard to be reusable across all tests, rather than building a dashboard for each test plan.
Latency Lingo is a simple, opinionated observability platform dedicated to web performance testing. It provides an out-of-the-box reporting toolset so that you don't need to design your own reporting infrastructure using domain expertise. The product is still very early, but please try it out and let me know your thoughts! If you're willing, I'd also love to chat with you about your performance testing problems to see how Latency Lingo can eventually help solve them. You can reach me by email and we'll schedule something.
Metric analysis and interpretation
Dashboards are useful for ad-hoc analysis, but you cannot expect your team to always be monitoring these dashboards. In some conditions, your team may want to be automatically notified so that you can start an investigation. An example of this case is if your performance tests suddenly cause an increase in error rate or response times.
I recommend setting up automated monitors that check your error rate and response times to help evaluate system health. These monitors can be configured to evaluate metrics over a specific time interval and at a specific frequency. You can also set these monitors to integrate with your paging systems like OpsGenie or PagerDuty to be notified when further investigation is required.
When deciding the conditions for your monitors a common approach is to define service-level objectives for each of your HTTP operations. You can read more about this in Google's book on site reliability engineering.
Besides comparing with defined response times and errors thresholds, here are some other conditions that you may want to evaluate:
- Throughput limit hit: Virtual users are increasing while requests per second have plateaued.
- Failure rate anomaly: Noticed a short-term spike in failure rate.
- Response time anomaly: Noticed a short-term spike in response times.
- Test plan duration: Overall execution time of a test plan.
- Load test environment CPU usage: Acceptable CPU usage for load test tool.
- Load test environment memory usage: Acceptable memory usage for load test tool.
- Negative historical trend: Response times or error rates are negatively changing across recent tests.
Teams should also develop a habit of reviewing performance dashboards manually on a recurring basis to identify any unexpected changes or potential bottlenecks that didn't trigger monitor alerts. This is useful collaborative process to ensure your software maintains good performance and better understand your systems.
Closing thoughts
To recap, these are the steps to analyzing performance testing results:
- Identify key metrics and dimensions.
- Emit these metrics from your load test runner and application to your observability platform.
- Build reporting dashboards for your metrics.
- Define automated monitors for unhealthy metric conditions.
- Analyze test runs to find bottlenecks and prioritize improvements.
I hope you've enjoyed this guide! I'm building Latency Lingo to help teams understand their performance test results, so I'd encourage you to sign up, try it out, and share any feedback.
If you're willing, I'd love to have a chat and learn about the performance testing problems you face. Please reach out and we can schedule something!