Introduction
Web performance is a broad and ever-evolving topic. Keeping up with the industry can be challenging for individuals, small businesses and large corporations alike. Luckily, more and more software solutions are emerging that make testing your site’s performance easier than ever before. This article covers what performance testing is, how it works, as well as some of its most common uses.
What is web performance testing?
Web performance testing is a process that software teams use to measure response times and error rates of their services under certain loads. Experimentation through performance tests provides a better understanding of your service's capacity for both backends and frontends. This deep understanding of your limits is crucial to providing a great user experience.
To provide an example, say an e-commerce company would like to test the amount of traffic that can occur on their website prior to a peak load event like Black Friday. They estimate that their peak traffic will include 100 active users per second, which occurs during the first 30 minutes of the day. An acceptable error rate over this duration is 0.01% - often referred to as four nines.
A performance tester will build a test plan to match these expectations with some buffer added. This plan would explain:
- What is being tested?
- How much traffic during the test? (100 active users per second)
- What is an acceptable error rate? (0.01%)
- How long should the test run? (30 minutes)?
- What type of traffic ramp-up to simulate? (immediate ramp-up)
- What are our objectives for response time?
Test plans are executed with a load test runner like JMeter, which will help send requests. Once the test is finished, the team will analyze the results, declare the test a success or failure, and decide the next steps.
This process of capturing web performance expectations, building test plans to simulate, executing the test plans, and analyzing test results is the practice of performance testing.
Why use web performance testing?
There are many benefits of this practice that make it an essential tool in your arsenal when ensuring a good user experience. Here are a few:
- Receive metrics that are not available from live traffic. With just performance metrics from live traffic, you cannot accurately predict the result of new traffic behaviours. Traffic spikes are a lot more common with today's ability to go viral.
- The web is a dynamic environment, with changes to the user's experience causing unexpected behaviour. A performance test can help you understand the impact of these changes and what to expect in future releases, thus providing an accurate estimate of how well your website is performing over time.
- Develop a deeper understanding of how your systems interoperate and their limits. These learnings are valuable as you build upon the systems and push them to support new functions.
- You can simulate a wide variety of scenarios, including cold starts, certain failure increases, impact to dependencies, load spikes, and other situations that could occur during anomalous periods of time.
The importance of performance testing has overall increased as users become less patient and more dependent on websites and applications. The nature of organic traffic has become spikier due to viral events and engineering teams need to stay ahead of this traffic by experimenting in a safe environment before it breaks things in production.
What can be tested in web performance tests?
Performance tests can be used to test and measure the performance of a website, mobile application, or backend API. The following are some of the scenarios that can be tested:
- Initial page load time of common site pages, eg. landing and product pages.
- How many users can a backend API handle at acceptable error rates and response times?
- How long does it take for users to walk through a common flow like checking out?
- When does a third-party service start degrading due to rate limit constraints?
- How much has a database query improved due to a newly added index?
Rather than tackling all this at once, we recommend starting from a top-down approach. Start with testing critical flows, then expand your tests to improve overall flow coverage, and lastly isolate APIs and other dependencies.
How to build a test plan?
To explain your test scenarios, a plan must be drafted. The test plan can be formally documented or just implicitly captured in the load test runner you use. Let's discuss the steps to building this test plan that apply to either methods.
Establish your performance baselines using metrics from existing traffic. This would include existing traffic, response times at varying measurements (eg. average, p75, p90), and error rates. Application performance monitoring from a solution like Datadog or Grafana is necessary to begin extensive testing of your services.
Decide on your test environment. Tests should typically be run in a dedicated staging or test environment to avoid impacting your users in production. The environment chosen may affect the variables decided on later.
Declare key performance indicators for your service performance. The specific metrics you measure depend on your business requirements. Here are some questions you should evaluate:
- Which response time percentiles are important to you (p50 vs p99)?
- Does error rate or count matter more?
- How do performance expectations change with the time of day/week?
Define performance objectives based on the baselines, expected traffic growth, and your key performance indicators previously identified. This often includes scenarios that account for steady growth and also scenarios capturing anomalous spike traffic.
Share your plan with stakeholders and get acceptance. Collaboration in testing is often overlooked but crucial to sharing responsibility and ownership across your teams. Ask for feedback on your plan to engage others and improve ease of maintenance in the future.
Now that you understand how you'd like to test your system, let's learn how to execute those tests!
How to run performance tests?
With your test plan ready, you'll need to decide on a load test runner to use if you don't have one already. The open-source solutions available are excellent with popular options including JMeter, Gatling, Locust, or K6. JMeter has historically been the most used and recommended.
Use the documentation from your load test runner to translate the test plan into a scenario you can simulate. This is written using a programming language or configuration files depending on the tool that you use. Some of these tools also accept your KPI metric objectives, whereas others will need you to confirm objectives are met on your own.
Here is an example test scenario defined in the JMeter GUI.
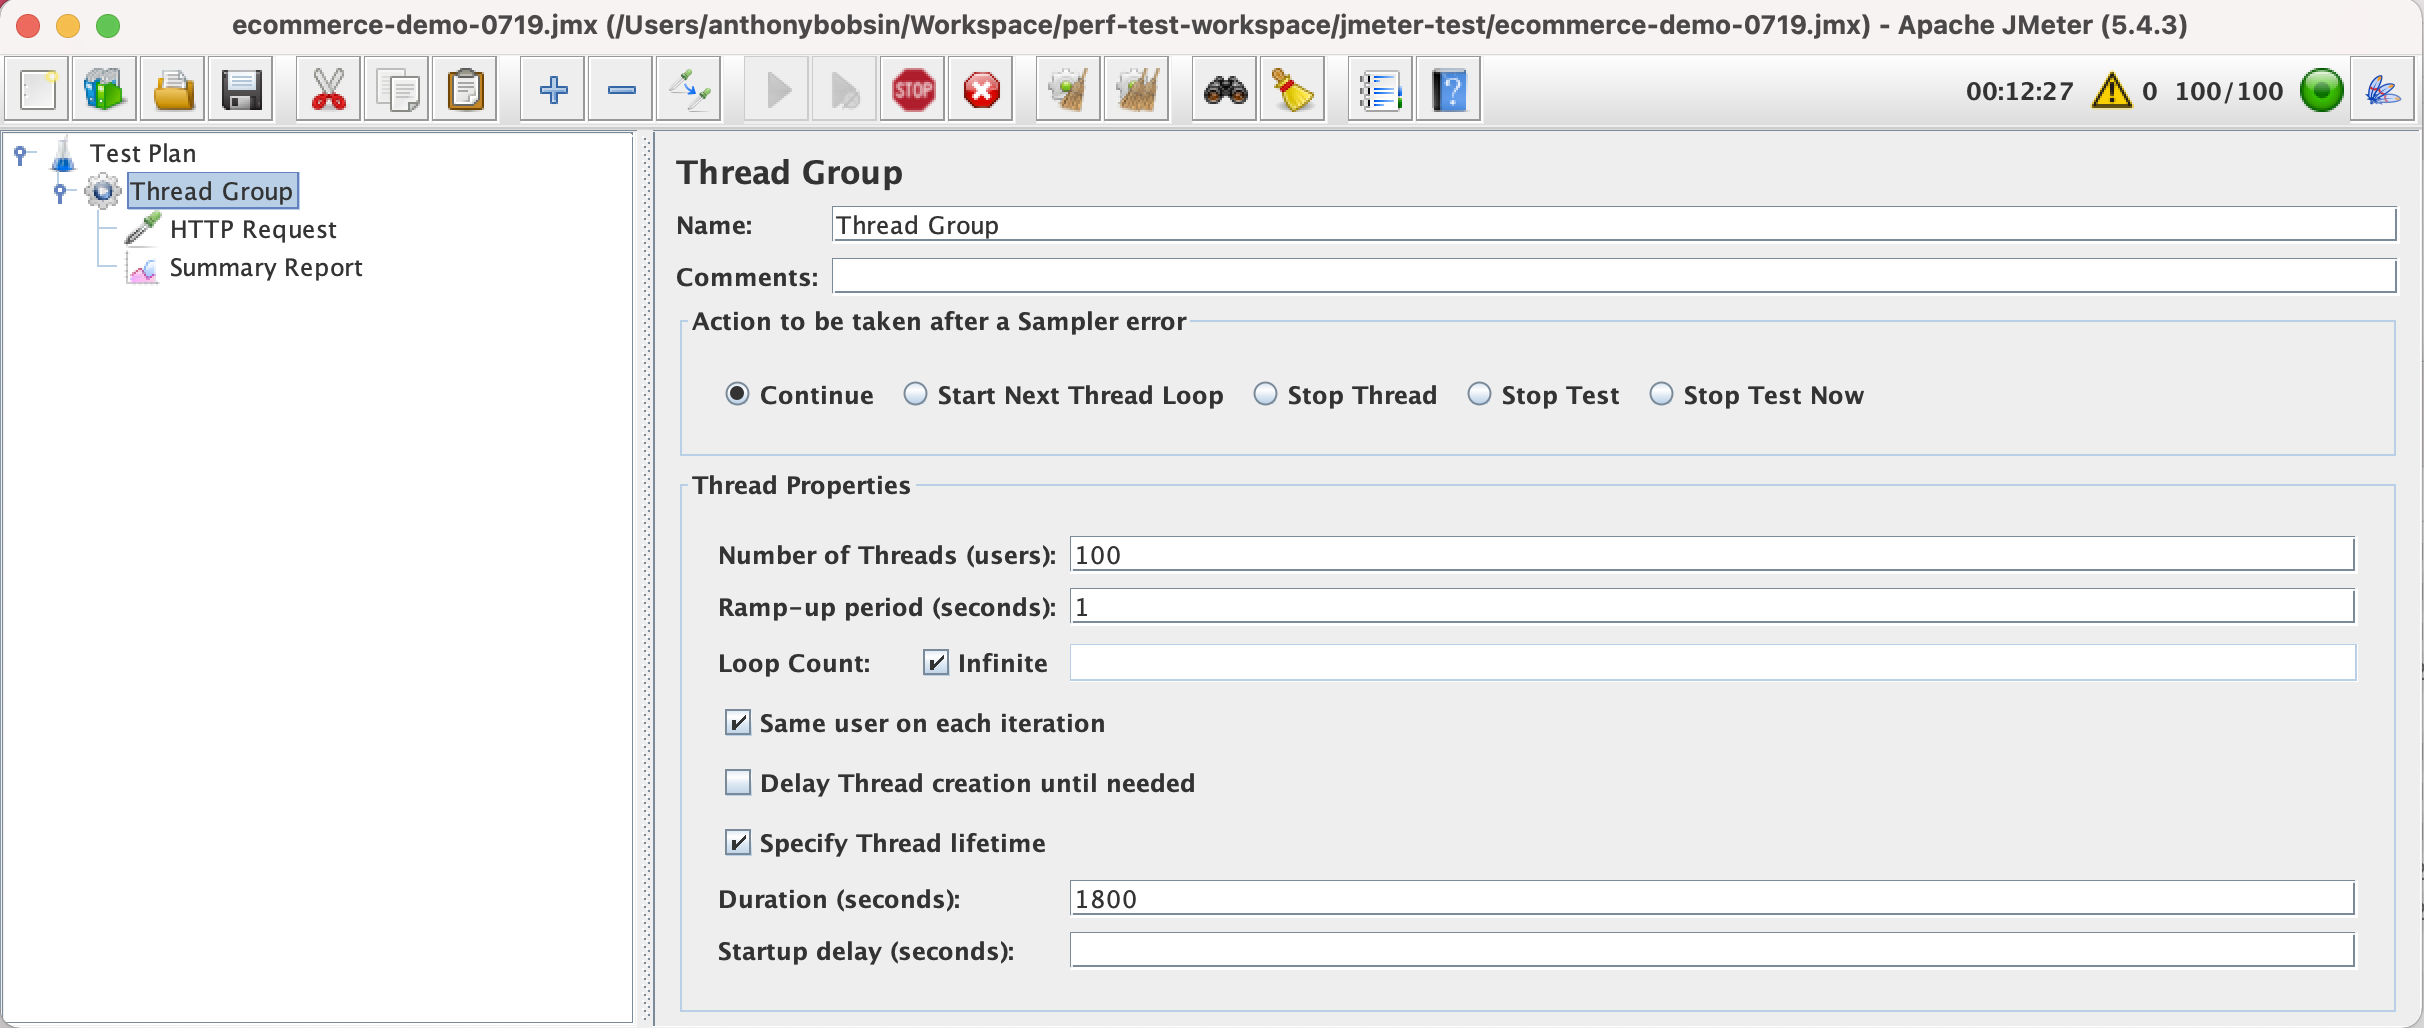


Load test runners can be executed manually on your own machine to start. As complexity and volume of simulations increase you should run these tests on servers with more capacity. With dedicated performance test servers, teams can automate the scheduling of executions to align with new releases or on a recurring time schedule.
It is expected that a test runner will watch for any degradation to the environment while testing. To help with this you should already have monitors in-place to detect negative impact.
While running, the load test runner will generate an output that contains metrics for each request executed. Next we'll learn what to do with this output.
How to analyze performance test results?
Once you’ve completed the process of running your performance tests, you need to analyze the results to decide the next steps.
First we will need an interface to view the result metrics. We'll look at three different interfaces here.
Use interface provided by test runner. Most test runners are able to generate an HTML file or some other report. The problem with these methods is that they are typically static reports, which are difficult to share with others and add your own context. You can view the JMeter HTML dashboard as an example.
How? Convert the output CSV to JMeter's HTML dashboard.
jmeter \
  -g ecommerce-demo-output.csv \
  -o ecommerce-demo-output
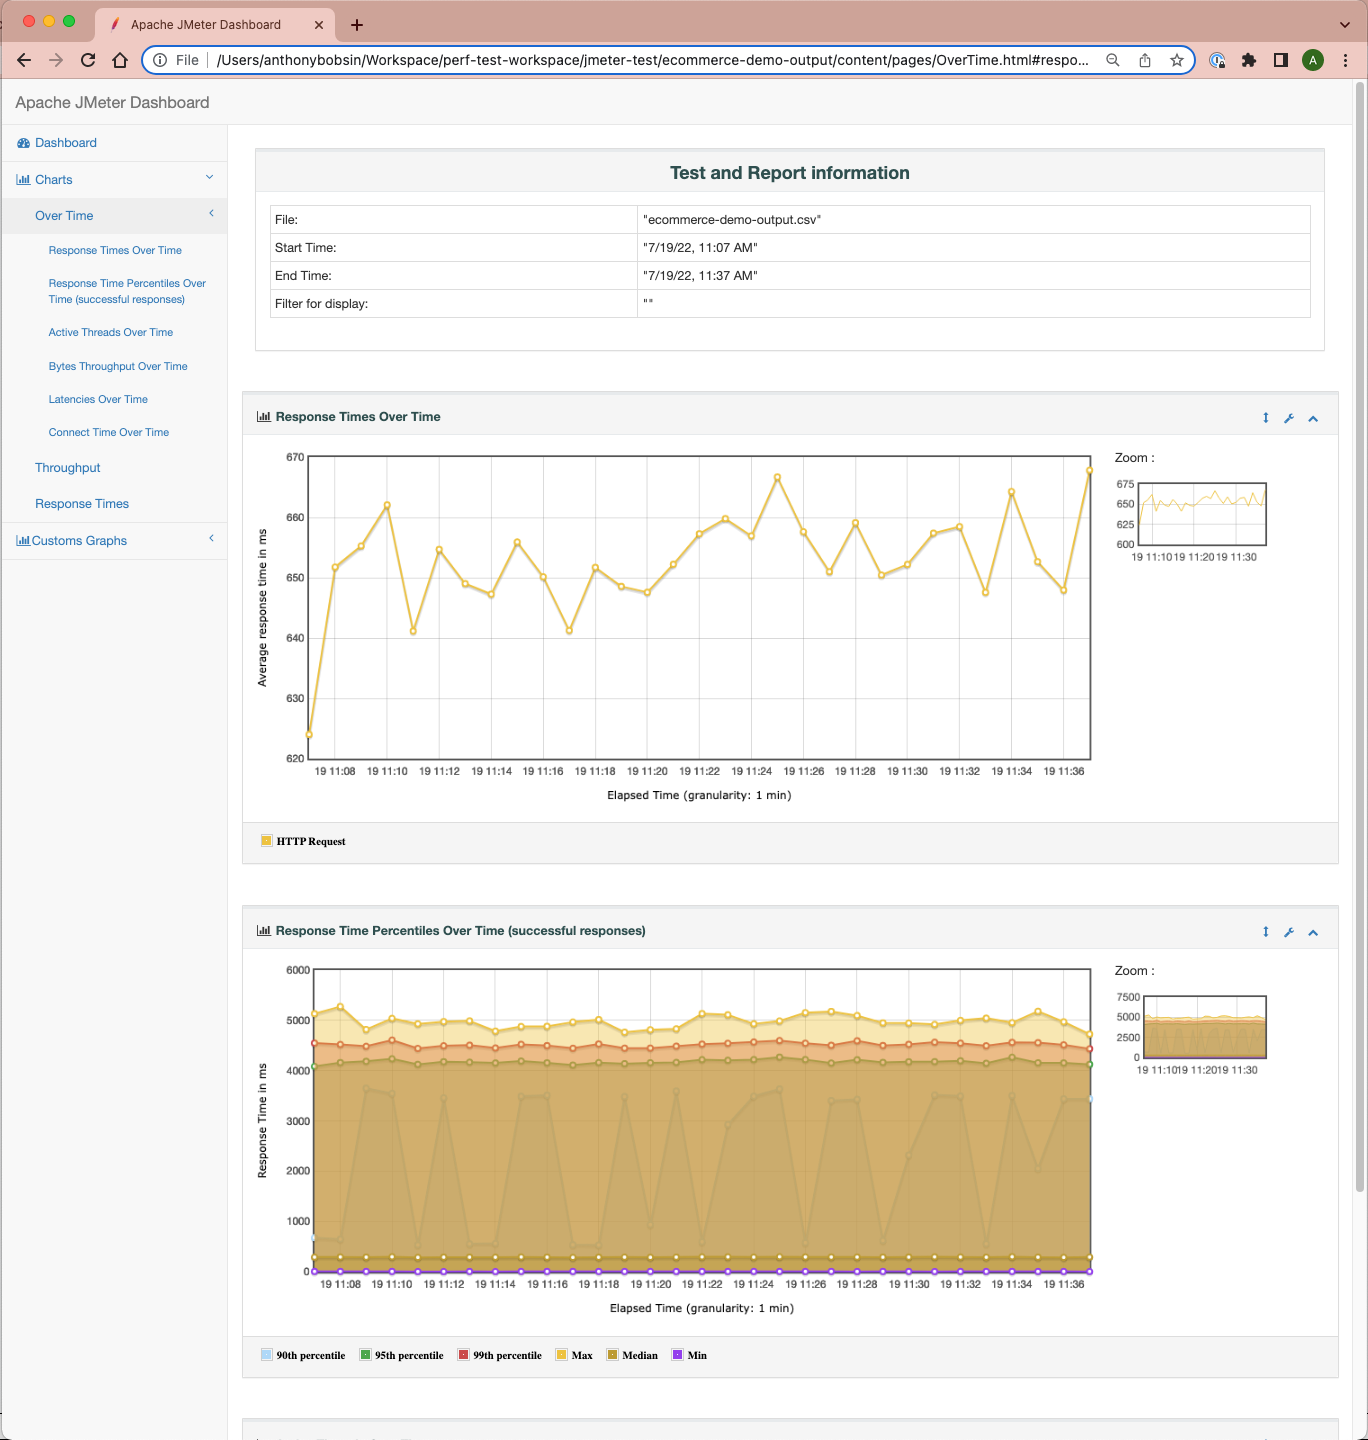
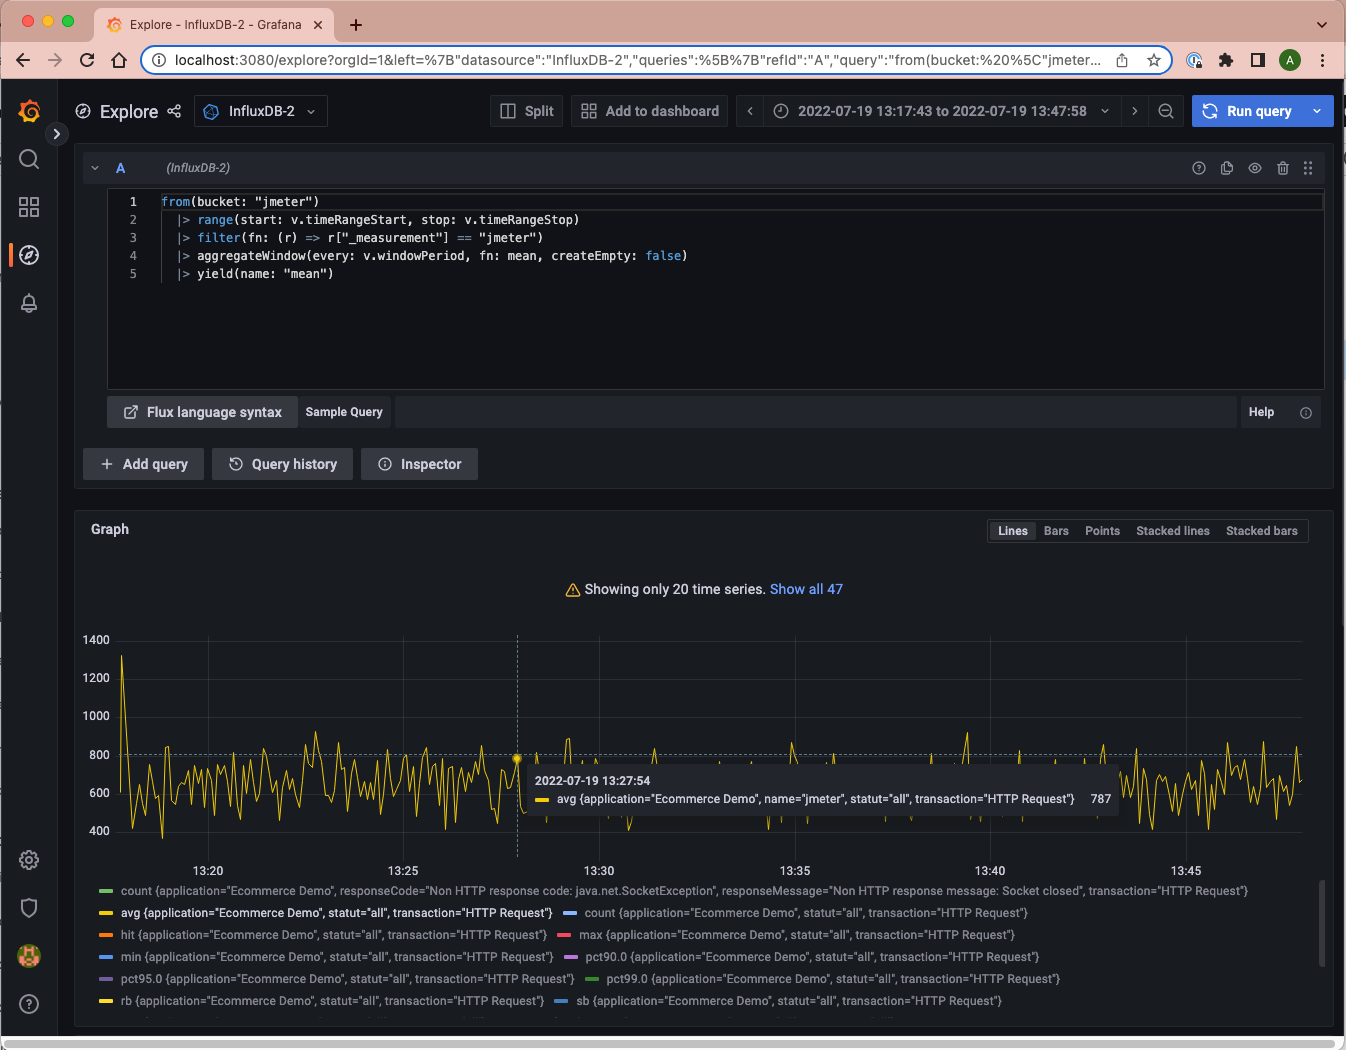
Send metrics to an observability platform like Grafana. This is a common approach, where teams send test result metrics to their existing observability platform. This has an added benefit of living alongside metrics from live traffic to encourage comparisons. Platforms like Datadog have a ton of features for you to use based on these custom metrics you emit like monitors and SLOs.
How? Read here to set up a Grafana, InfluxDB, and JMeter integration.
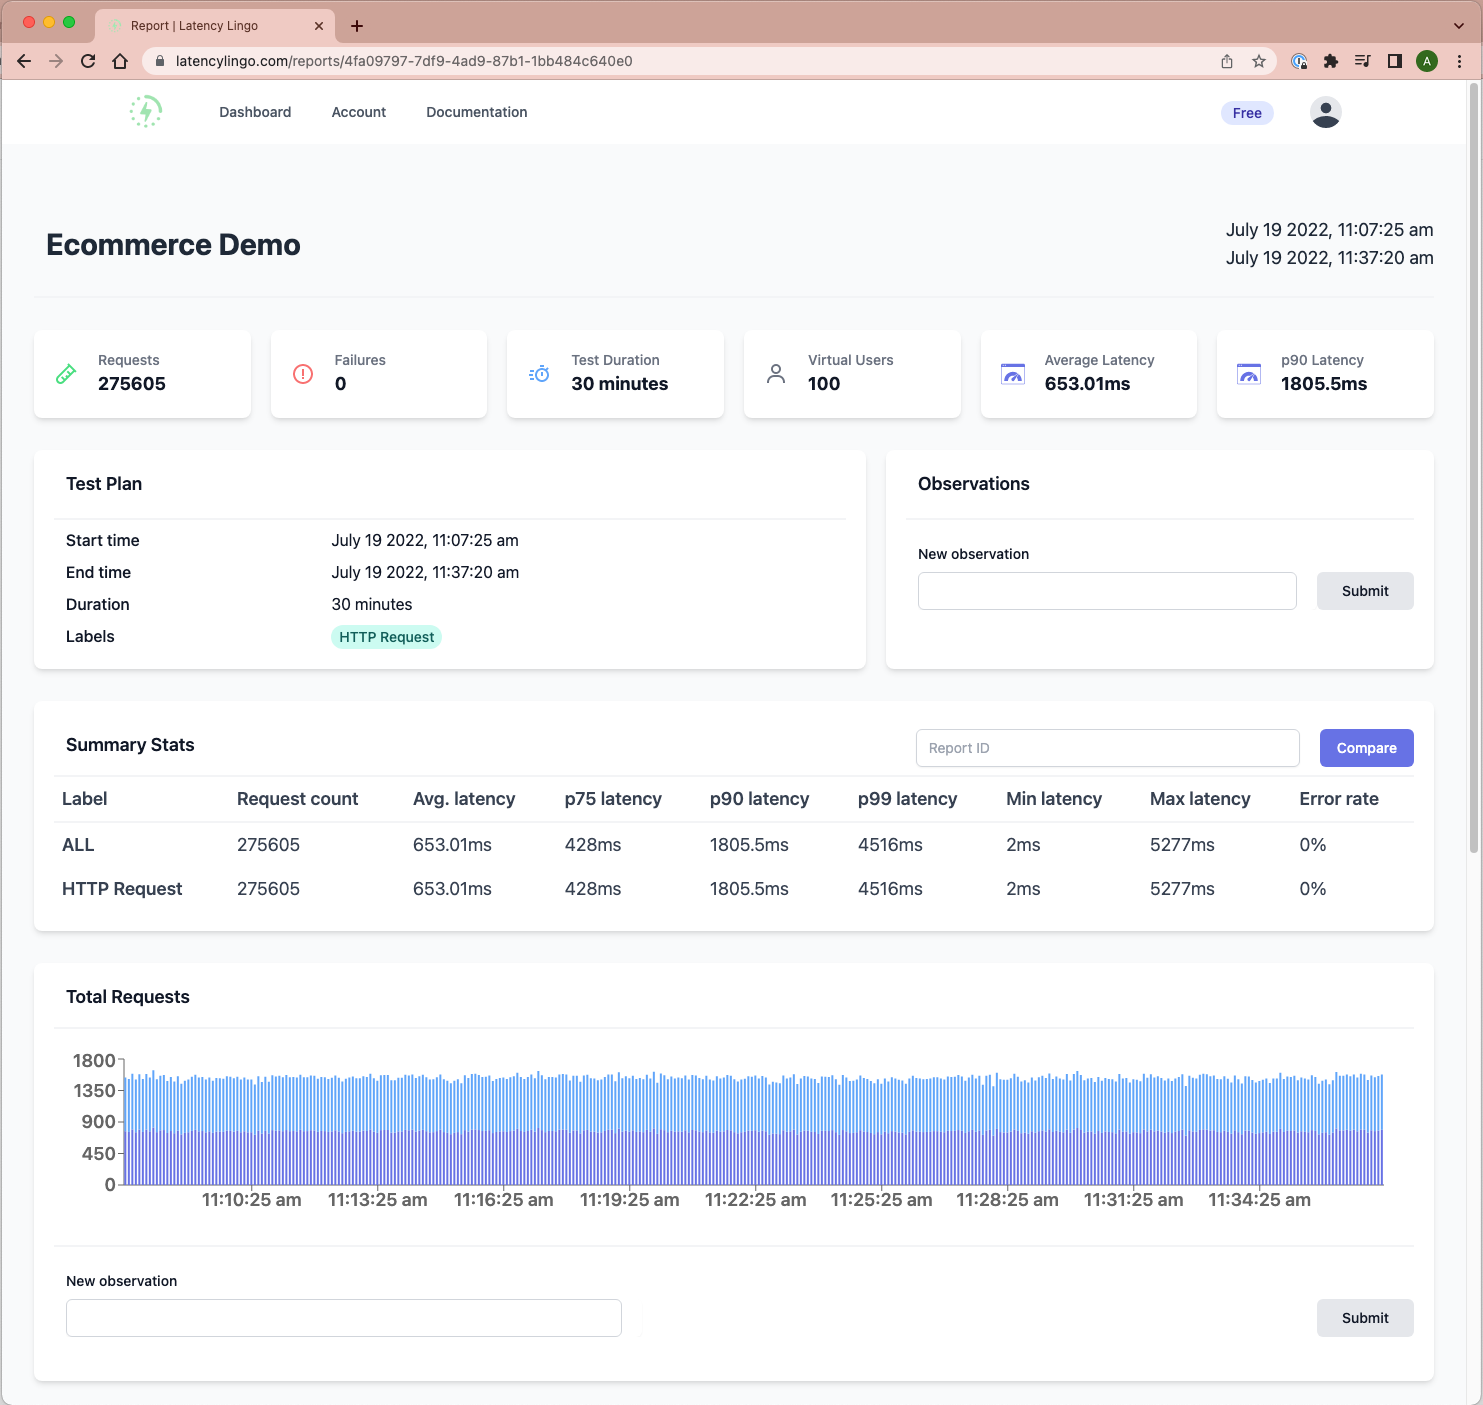
Send metrics to a dedicated testing analytics platform like Latency Lingo. Even after emitting metrics to an observability platform, there are still some gaps in collaboration and automation that is useful for software testing. Dashboards and monitors need to be manually crafted with testing domain expertise. Analysis that requires collaboration will occur outside of the platform in some Google Sheet or Confluence document. Latency Lingo solves for this by providing a dedicated space to analyze and collaborate on your performance test results.
How? Publish the output CSV to Latency Lingo APIs using the CLI.
latency-lingo-cli \
  --file ~/Workspace/perf-test-workspace/jmeter-test/ecommerce-demo-output.csv \
  --label "Ecommerce Demo"
Once performance metrics are sent to Latency Lingo, you'll receive dashboards for all your tests, monitors to help catch degradation, and a way to document observations for team members to learn from.
View the report from this demo.
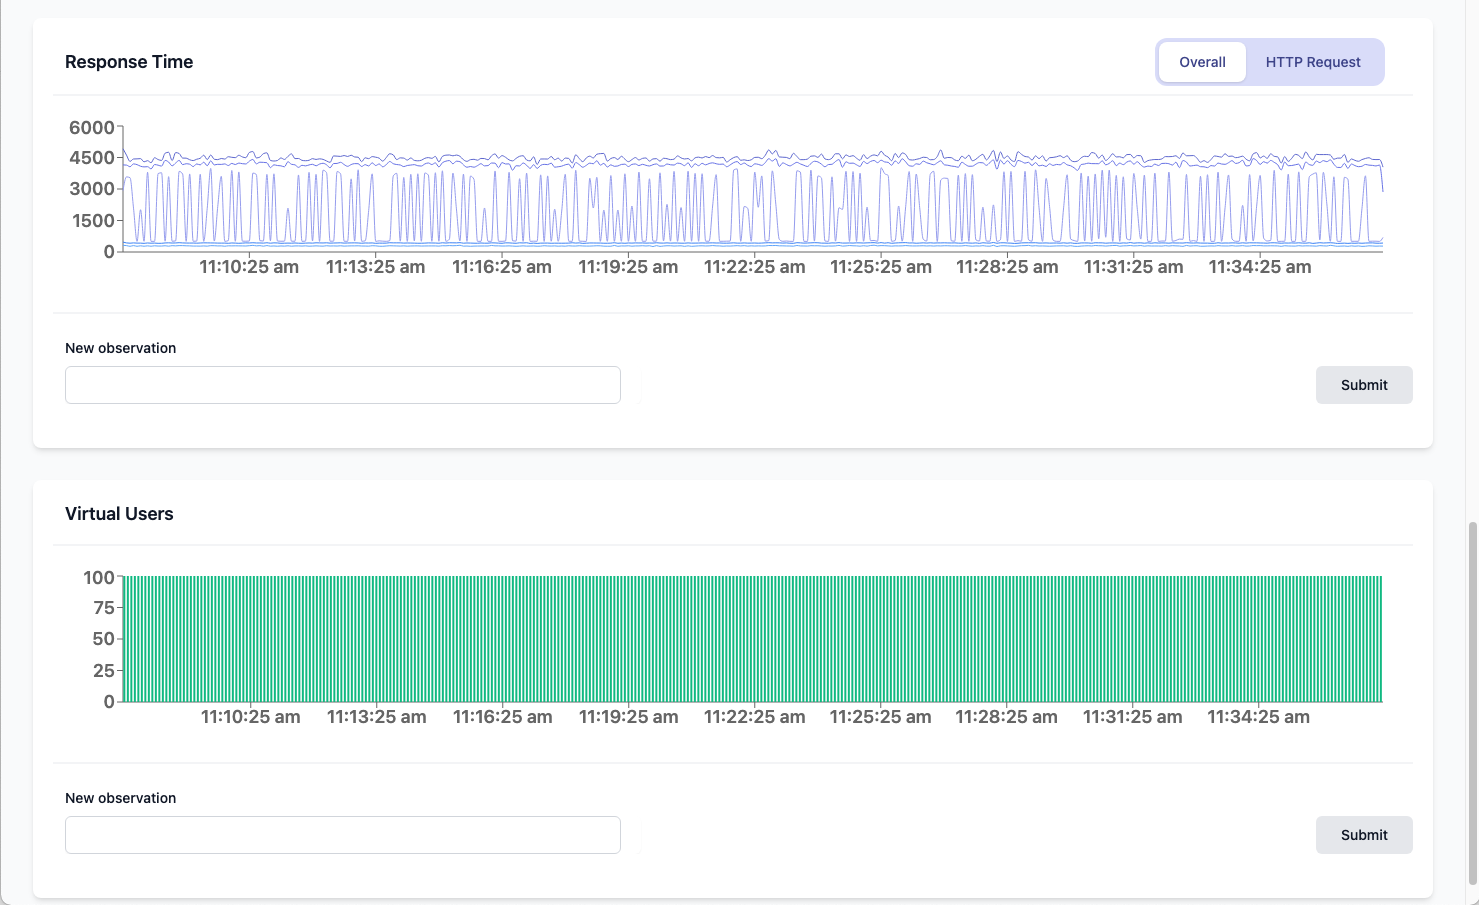
With an interface available, you can now compare the results with your test plan's objectives. These are some questions you may ask yourself:
- Have your objectives been met for response times, error rate, and request count?
- Do you have an acceptable buffer for anomalies that occur in live traffic?
- Do you see new errors that need to be addressed?
- Are there other key metrics that you found impactful but are not included in your KPIs?
- Are there anomalous spikes that are unexpected but hidden when viewing overall metrics?
- Does your understanding of system performance and limits match the behaviour witnessed?
- Is there noticeable issues in this environment that are not reflective of production?
As you analyze the metrics and answer these questions, you may notice some action items that need to be reported. Add these action items to your test report for future prioritization.
Closing thoughts
Once analysis is complete, share your learnings with the team to see if others have the same observations. Software testing is a collaborative process that your team should learn from together.
Performance testing can be tedious and bog down velocity for your team if you allow it. Always think how to automate steps in the processes you develop and reduce the manual burden required. Automation is the key to scale and repeat these processes.
Where to learn more?
Still have questions or have a request for additional content?
Latency Lingo is a tool to help you analyze JMeter results, so I'd encourage you to try it out. I would really appreciate any feedback you have!
I've attached links below to documentation of the tools and processes discussed. Thanks for reading!
