Performance testing involves sending requests to an application to help find performance issues and confirm that it runs as expected. This is a difficult task and can be especially tedious for those who have not worked with test automation before.
In this article, we will demonstrate how you can automate performance tests with JMeter and Github Actions. You can find the source code for all examples in this Github repo.
JMeter and Performance Testing
JMeter is a tool that allows you to write and run performance tests against your application. There are many other tools for generating load for testing purposes, but JMeter is one of the most mature. Similar alternatives include K6, Gatling, and Locust.
JMeter provides both a graphical user interface and a command-line interface. It is common for teams use the GUI to edit their test plan and the CLI to execute the test plan. The CLI is especially convenient for invoking tests on an automation server.
Performance testing can apply to a large variety of systems. JMeter has tremendous support for a wide range of protocols and load testing strategies. This is what has popularized JMeter over the decades - the ability to handle any type of load test scenario.
Set Up Your Environment
There are two environments we will need to setup to start running our automated tests.
- A testing or staging instance of the application being tested.
- An automation server where we can execute JMeter against the test application.
You may already have some testing or staging instance of the application from your manual testing efforts. Consider creating a dedicated instance for performance tests to avoid manual testers or other forms of automation from impacting the results.
For the automation server you have many services at your disposal to reduce the maintenance burden. I recommend Github Actions, Jenkins, Circle CI, or Travis CI. The main idea is to have some server that listens for code changes and can execute steps that depict whether the code change is safe or not.
Github Actions are simple to setup and will be used in this demo. We'll configure PerfAction on our Github repo to execute JMeter tests on new code changes.
Create A Test Plan For Your Automated Tests
With your test environment set up, you can now create a test plan. This is how you communicate to JMeter what requests it should run and in what order. Please see my other article for an overview on building a test plan.
For the purpose of this demonstration, I created a basic test plan that walks through a checkout flow for an online storefront. You can view the test plan here.
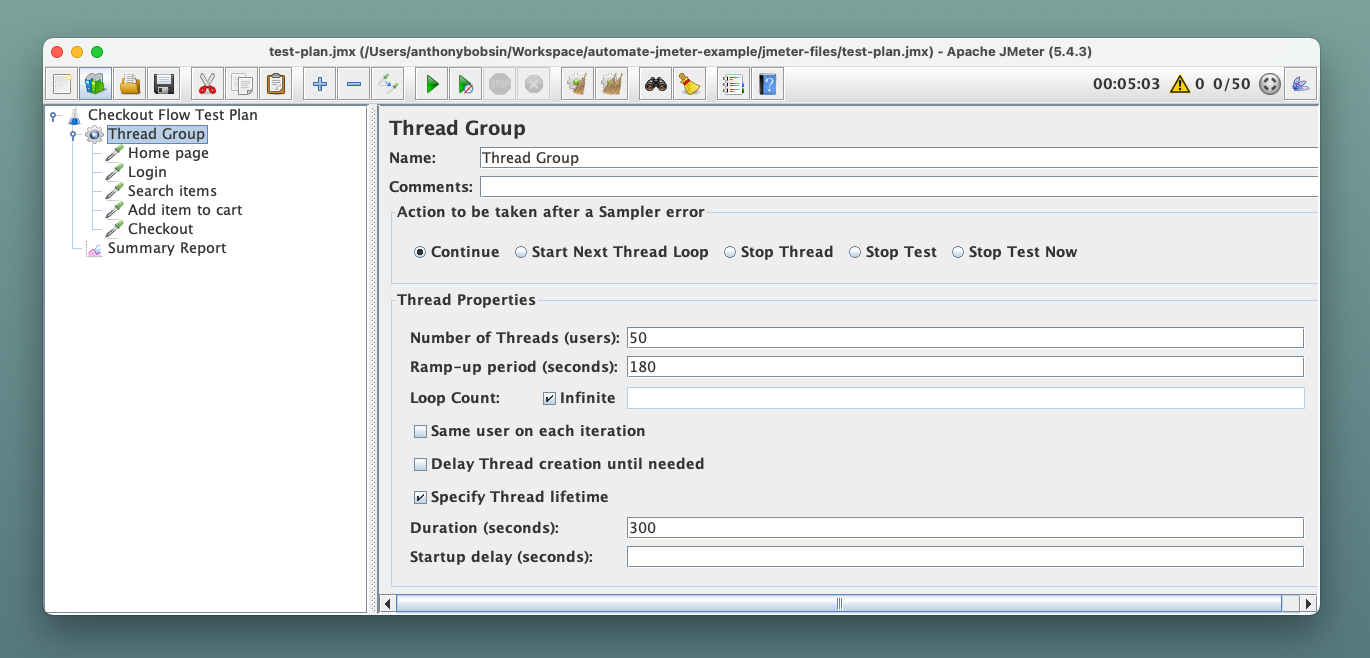
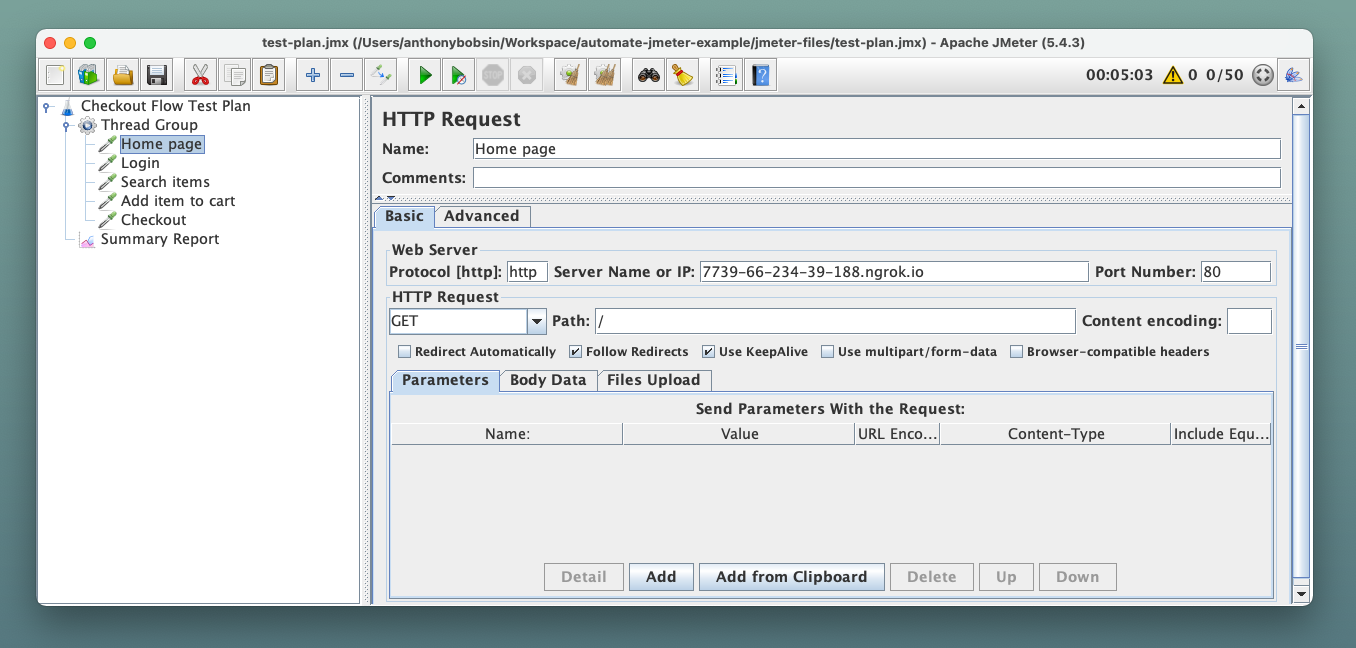
Our test plan iterates five different endpoints to take the user from signing in to checking out. It will simulate 50 concurrent users repeating these checkout steps for 5 minutes with a 2 minute ramp-up period.
Your automation test plan should not be an extreme load test, but rather focused on a comfortable load that gives an accurate representation of performance. There are chances that this test plan could be executed concurrently for multiple changes and if the volume is too large it can impact your test environment.
Always be sure to share your test plan with team members for other opinions!
Run a Test and Analyze Results
Before we can schedule our test plan for automation, you should manually test it on a safe environment and also ensure you have system observability through application metrics.
Instrumenting system and application metrics is a recommended prerequisite to adopting this level of testing. Teams typically use Grafana, Datadog, Dynatrace, or Sentry for this purpose. During manual tests, the tester is actively monitoring the results and can stop the tests if unintended impact is noticed. When these tests start running automatically, you cannot afford to have someone monitoring each time the tests are run.
To accommodate this lack of a tester monitoring the results, you can leverage automated monitors in your chosen observability platform. These monitors define conditions for when the environment is healthy and the team should get paged if the conditions are breached.
Here are some basic monitors as an example.
- 5xx error rate eg. 5xx percentage < 1%.
- 4xx error rate eg. 4xx percentage < 10%.
- Response time at a specific percentile eg. latency p75 < 5s.
These monitors are not exhaustive and I suggest you learn more about what metrics indicate poor performance for your specific application.
Setting up an observability platorm and monitors is out-of-scope for this guide, but there are a lot of good resources available. For example you can follow this guide by QAInsights to start emitting JMeter metrics to Grafana using InfluxDB.
Latency Lingo can also help you set thresholds and collaborate on performance testing reports. Thresholds are used to alert you when performance is outside of a healthy range, which is especially useful in CI/CD environments.
Automation with CI
We are now ready to create our automation workflow that runs the test plan. Let's finish configuring PerfAction to execute our test plan and also use the Latency Lingo Github Action to analyze test results.
Github Actions are configured using YAML files within your Github repo's .github/workflows directory. Please refer to their documentation for any details.
Github Actions revolve around jobs and steps. A job is a collection of steps that are executed in sequence. A step is a single command that is executed. Step commands can invoke other published actions or a manual bash command.
The snippet below is the actions file we'll use to run our test plan. You can view the source code here. We will step through this example to show how it works.
on: [push]
jobs:
  Main:
    runs-on: ubuntu-latest
    steps:
      - uses: actions/checkout@v3
      - name: Run JMeter Tests
        uses: QAInsights/PerfAction@v3.1
        with:
          test-plan-path: jmeter-files/test-plan.jmx
          args: ''
      - name: Upload Results
        uses: actions/upload-artifact@v2
        with:
          name: jmeter-results
          path: result.jtl
      - name: Analyze Results with Latency Lingo
        uses: latency-lingo/github-action@v0.0.2
        with:
          api-key: ${{ secrets.LATENCY_LINGO_API_KEY }}
          file: result.jtl
          label: Checkout Flow Automated Test Plan
          format: jmeter
For our example, we have a single job called Main that has five steps. The on argument tells the workflow to run on each push to a remote branch. The runs-on argument tells the workflow to run on Ubuntu Linux.
Most of the complexity lives within the steps we define, so let's explain them one-by-one.
- Pull the Github repo to make it available in future steps.
- uses: actions/checkout@v3
- Use PerfAction to run our JMeter test plan.
- name: Run JMeter Tests
  uses: QAInsights/PerfAction@v3.1
  with:
    test-plan-path: jmeter-files/test-plan.jmx
    args: ''
- Store the JMeter results as a Github artifact for future reference.
- name: Upload Results
  uses: actions/upload-artifact@v2
  with:
    name: jmeter-results
    path: result.jtl
- Finally, we'll publish our results to Latency Lingo. The CLI requires the API key found in your account settings. We use Github Actions secrets to store it safely. You can update the label to match your test scenario.
- name: Analyze Results with Latency Lingo
  uses: latency-lingo/github-action@v0.0.2
  with:
    api-key: ${{ secrets.LATENCY_LINGO_API_KEY }}
    file: result.jtl
    label: Checkout Flow Automated Test Plan
    format: jmeter
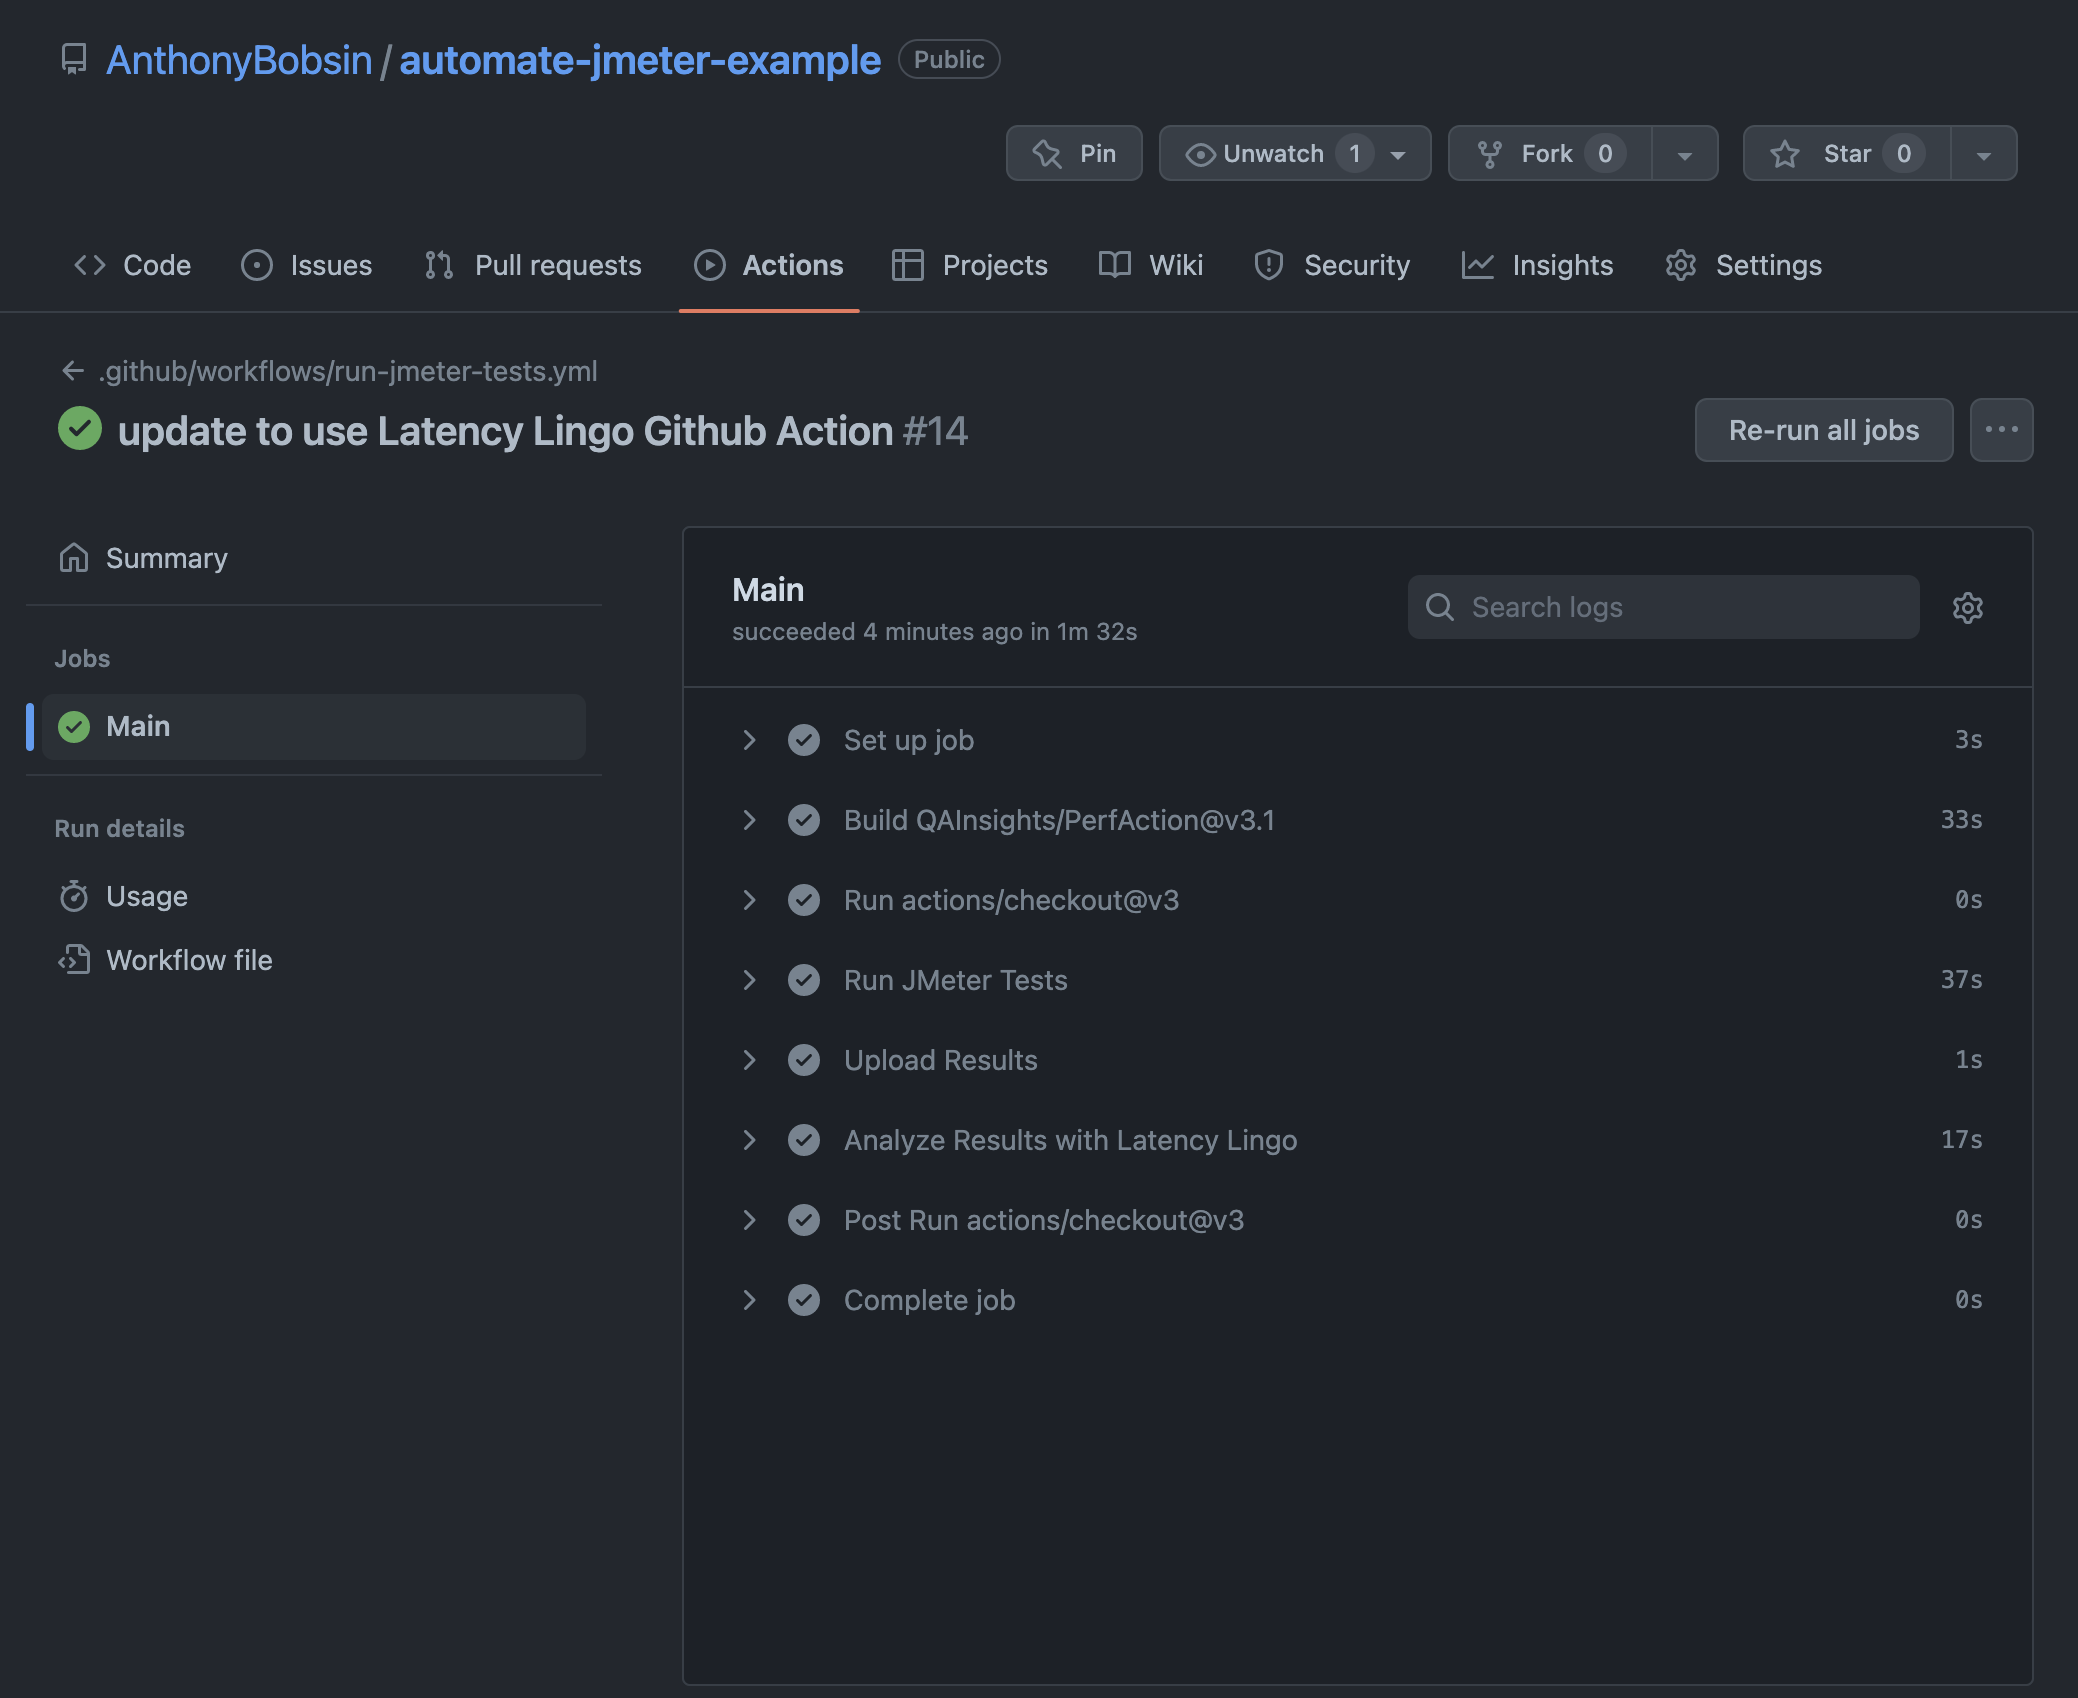
Now whenever we push a commit, you should see that Github Actions will run all these steps automatically.
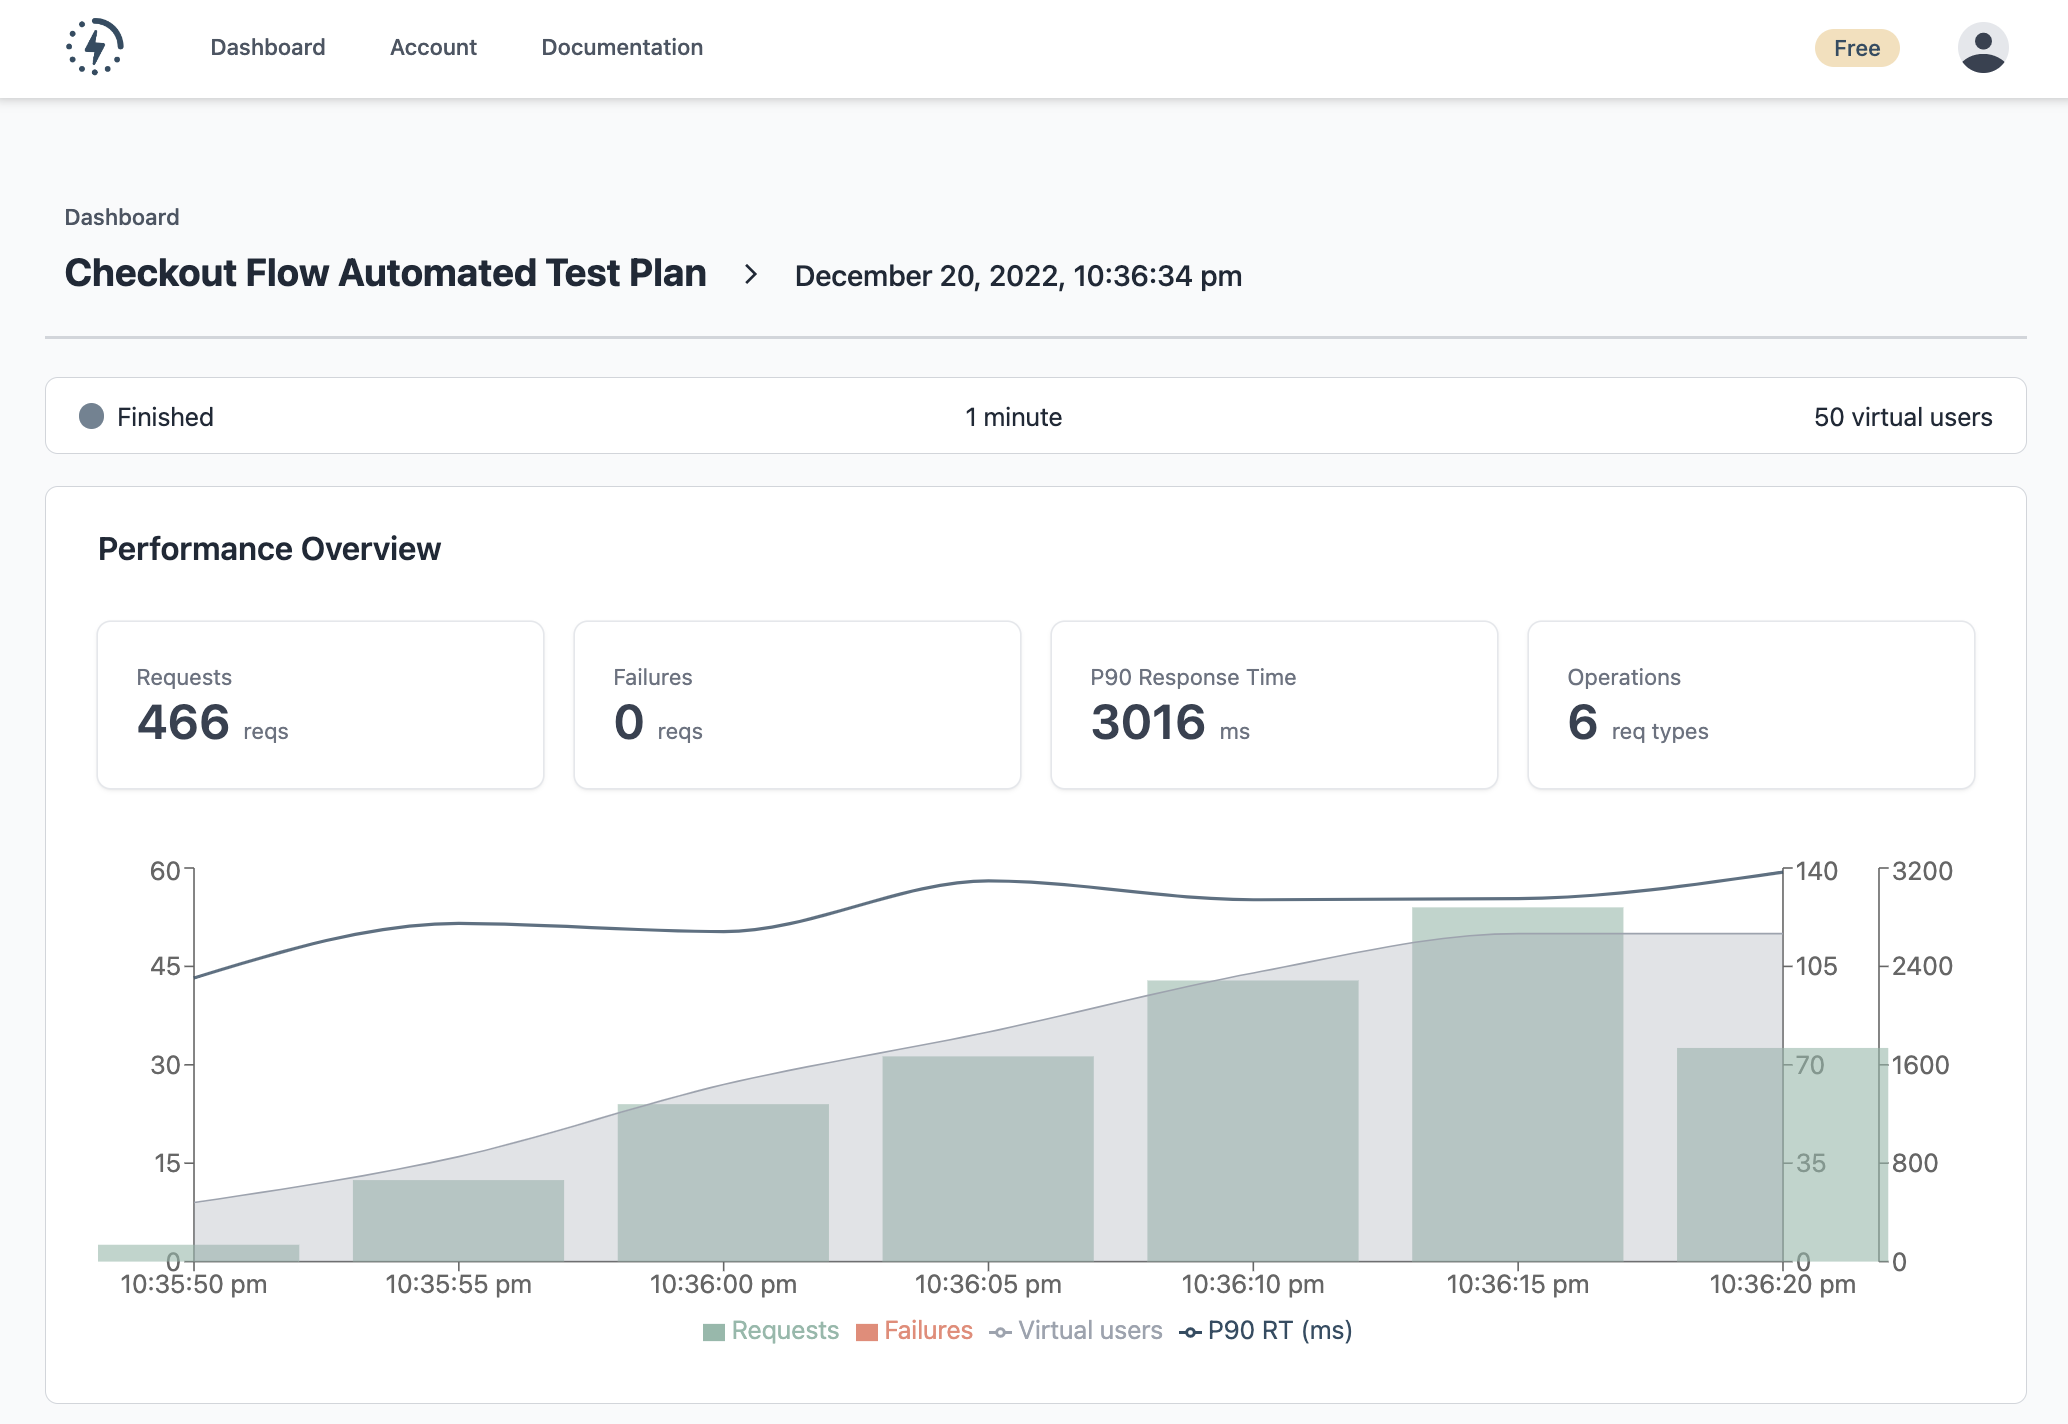
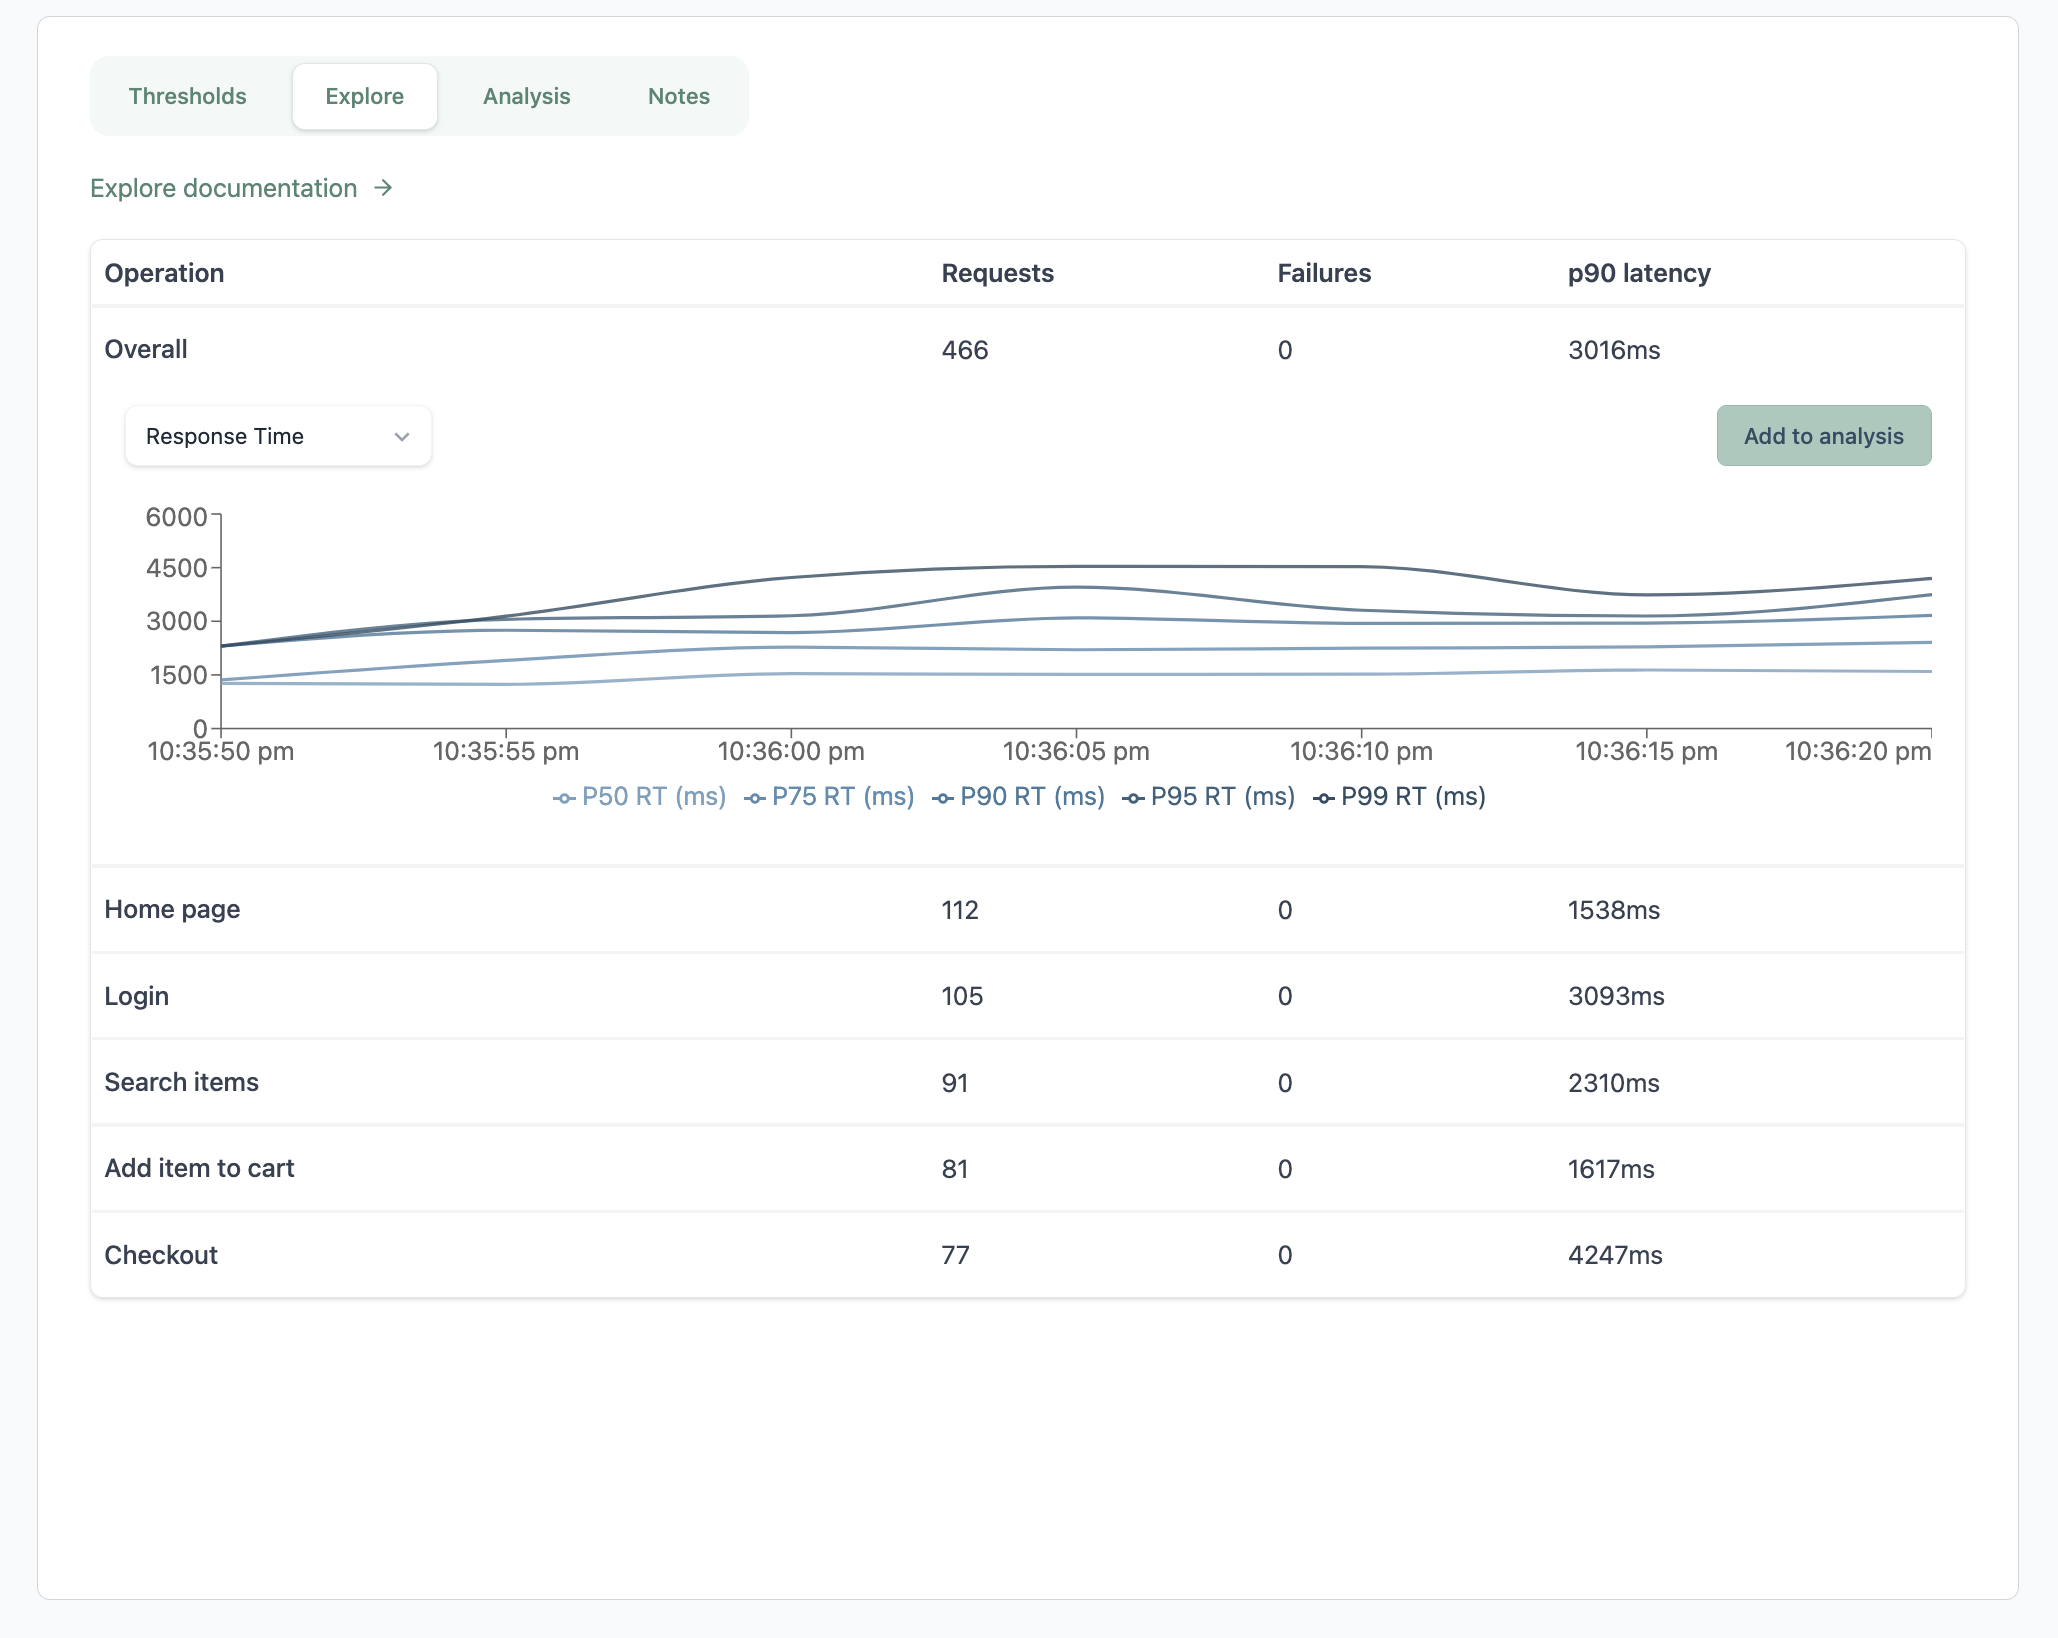
The output is a test report generated in Latency Lingo where we can view the test results. If you configured instrumentation and monitors, you can verify the data is populated there as well.
Closing Thoughts
Performance testing is essential for validating that your application runs as expected under various loads. It can be a difficult task for anyone who has not worked with test automation before. With the right tools and processes in place, it can be easy to leverage automated performance testing to improve your product quality.
You can visit the documentation to learn more about how Latency Lingo can help your team performance test effectively. Sign up for free to try it out and please share any feedback!
Have any questions or want to hear more?